1. Zscaler Digital Experience Fundamentals
1. What is Zscaler Digital Experience (ZDX)?
Answer:
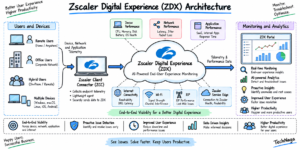
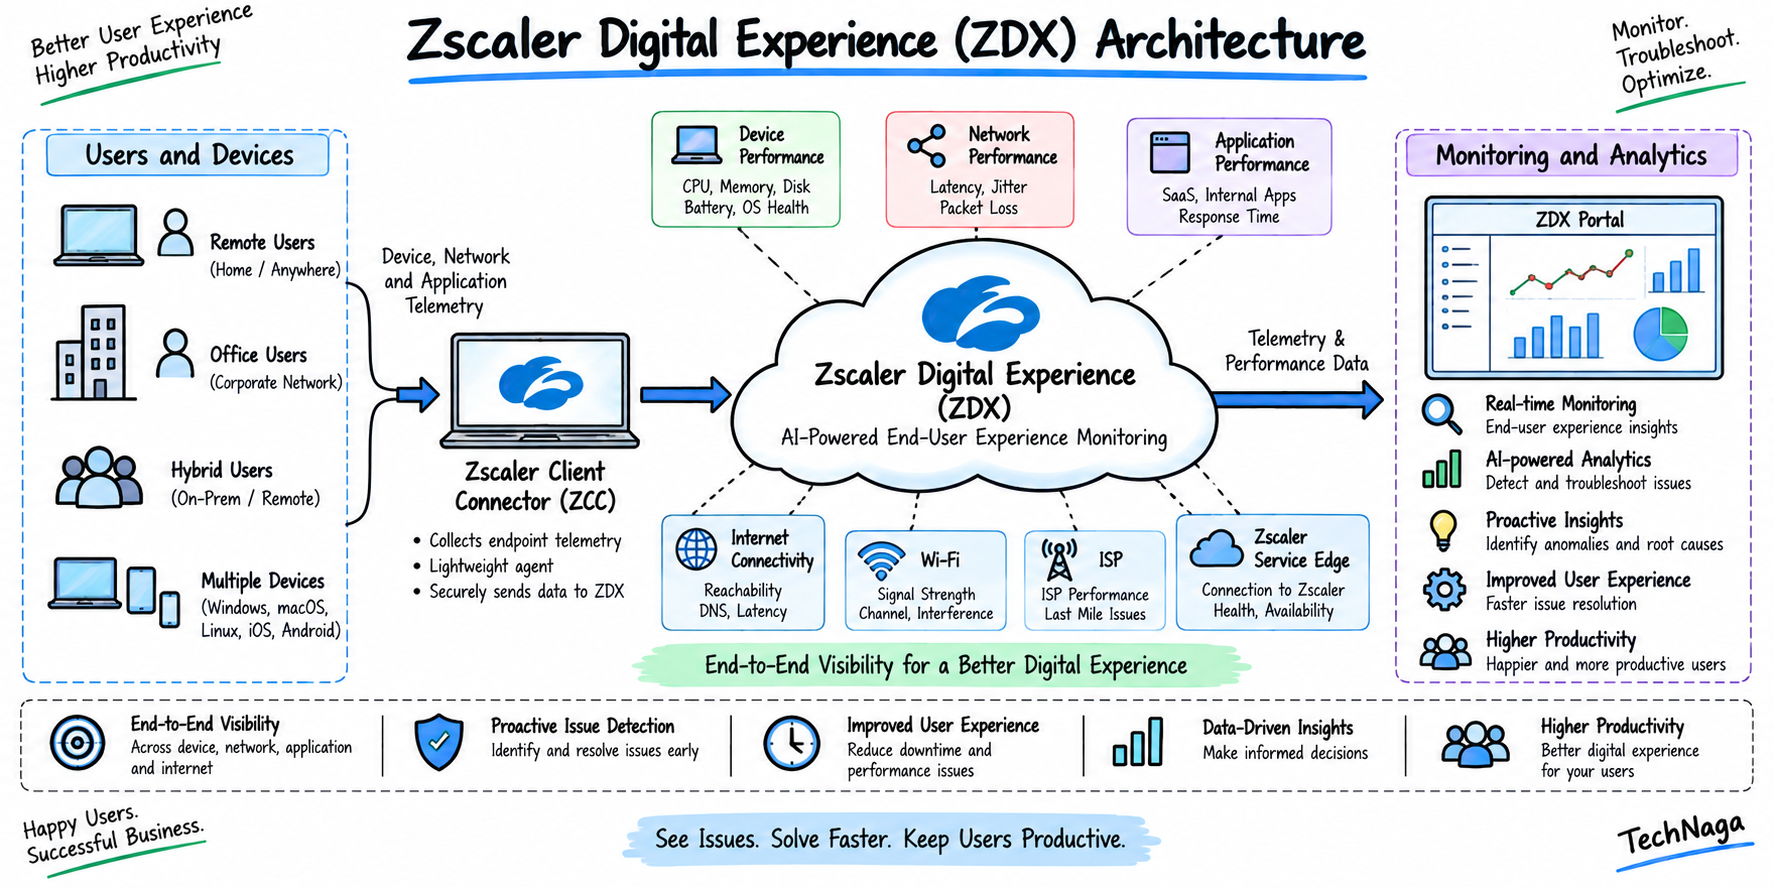
Zscaler Digital Experience (ZDX) is a Digital Experience Monitoring (DEM) solution that provides visibility into the performance of users, devices, networks, and applications. ZDX helps IT teams identify whether a performance problem is related to the endpoint, Wi-Fi, ISP, network path, Zscaler service, or application.
ZDX uses telemetry from Zscaler Client Connector, synthetic probes, and Real User Monitoring to provide end-to-end visibility into the user’s digital experience.
2. Why is ZDX used in enterprise environments?
Answer:
ZDX is used to monitor the digital experience of users across remote offices, branch locations, home networks, and corporate environments. It helps IT teams identify performance issues that traditional monitoring tools may not see clearly.
For example, if users report that a SaaS application is slow, ZDX can help determine whether the problem is caused by the device, local Wi-Fi, ISP, network path, Zscaler service, or application.
3. What problems does ZDX help troubleshoot?
Answer:
ZDX can help investigate problems such as:
- Slow web applications
- High network latency
- Packet loss
- DNS delays
- Poor Wi-Fi performance
- ISP problems
- Device performance issues
- Application availability problems
- ZIA or ZPA-related experience issues
- SaaS application performance problems
ZDX provides visibility across the path from the user’s device through the network and toward the application.
4. How is ZDX different from traditional network monitoring?
Answer:
Traditional network monitoring generally focuses on network infrastructure such as routers, switches, links, and servers. ZDX focuses on the user’s digital experience across the device, network, Zscaler cloud, and application.
This makes ZDX useful for troubleshooting modern hybrid environments where users and applications may be distributed across different networks and cloud platforms.
5. What is the role of Zscaler Client Connector in ZDX?
Answer:
Zscaler Client Connector acts as an important telemetry source for ZDX. It runs on the user’s endpoint and provides information that ZDX can use to evaluate device and network conditions and perform probes toward configured applications.
This allows ZDX to analyze the user’s experience from the actual endpoint rather than relying only on centralized network monitoring.
2. Zscaler Digital Experience Architecture and Monitoring
6. How does ZDX work?
Answer:
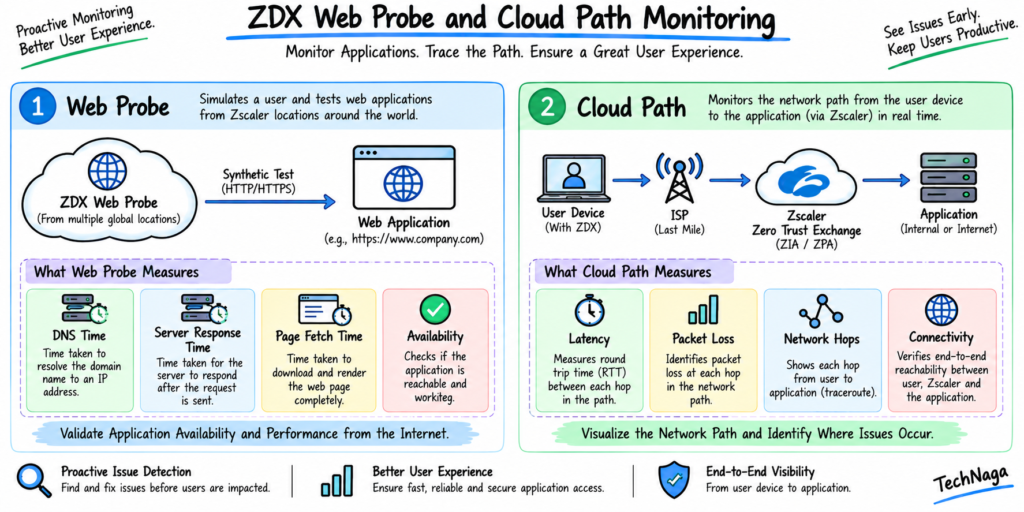
ZDX collects performance information from user devices and configured applications. Depending on the configuration, it uses Web Probes, Cloud Path Probes, and Real User Monitoring (RUM).
The collected information is analyzed in the ZDX platform to calculate experience scores, identify performance degradation, and provide visibility into possible root causes.
The general flow is:
User Device → Client Connector → Probes/Telemetry → ZDX Cloud → Analytics → Troubleshooting Insights
7. What is the ZDX Score?
Answer:
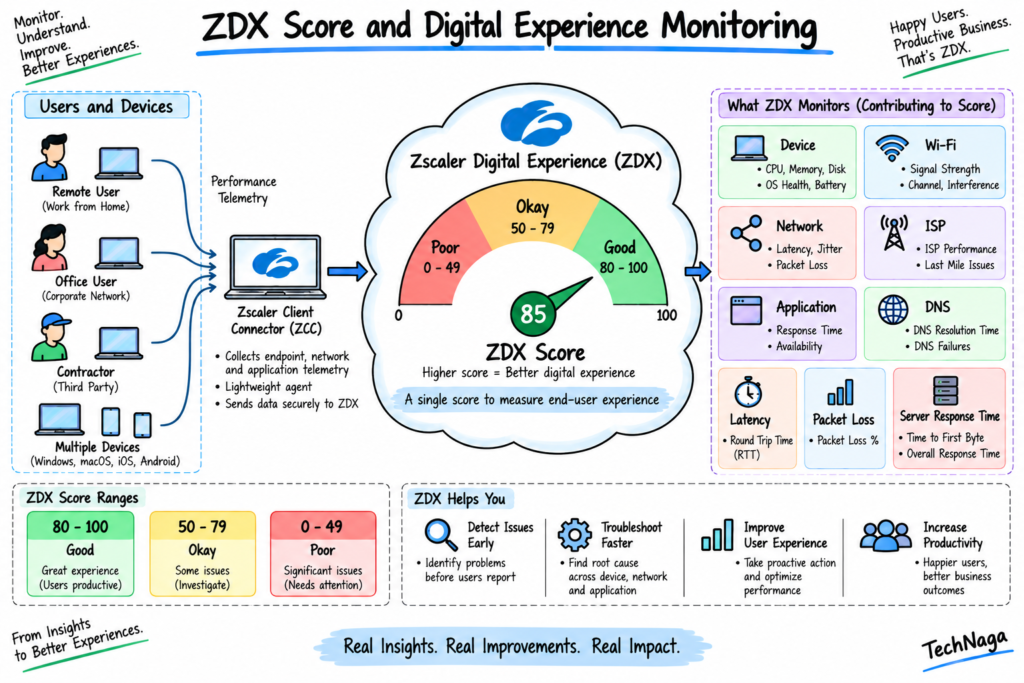
The ZDX Score is a numerical representation of digital experience. It ranges from 0 to 100, where a higher score represents a better experience.
Current Zscaler documentation categorizes the score as:
- 66–100: Good
- 34–65: Okay
- 0–33: Poor
The score can be viewed for users, applications, locations, departments, and other dimensions depending on the dashboard and configuration.
8. How is the ZDX Score calculated?
Answer:
The calculation depends on the type of monitoring configured. ZDX can use metrics from synthetic probes, RUM, or a combination of both.
For example, Web Probe measurements can include Page Fetch Time, Server Response Time, DNS Time, and Availability, while Cloud Path measurements include network metrics such as latency and packet loss.
9. What is a Web Probe in ZDX?
Answer:
A Web Probe is a synthetic test used to measure the performance and availability of a web application.
It can provide metrics such as:
- Page Fetch Time
- Server Response Time
- DNS Time
- Availability
These measurements help determine whether users are experiencing application performance problems.
10. What is a Cloud Path Probe?
Answer:
A Cloud Path Probe is used to evaluate network-path performance. It provides visibility into metrics such as:
- End-to-end latency
- Packet loss
- Network hops
- Probe errors
ZDX can use Cloud Path information to investigate problems between the client, ISP, Zscaler cloud, and application.
3. Zscaler Digital Experience Metrics
11. What is Page Fetch Time?
Answer:
Page Fetch Time represents the time required to fetch the requested web page. It is an important metric for understanding the user’s application experience.
ZDX can break down page performance into components such as DNS time, TCP connection time, SSL handshake time, and server response time, helping administrators identify where delays occur.
12. What is Server Response Time in ZDX?
Answer:
Server Response Time represents the time taken for the server to begin responding to a request. ZDX documentation associates this with Time to First Byte (TTFB).
A high server response time can indicate a problem on the application or server side rather than necessarily being caused by the user’s local network.
13. What is DNS Time in ZDX?
Answer:
DNS Time measures how long it takes to resolve the hostname into an IP address.
If DNS Time is significantly higher than expected while other network metrics are normal, the investigation should include the user’s DNS configuration, DNS server, resolver path, and DNS service availability.
14. What network metrics does ZDX provide?
Answer:
ZDX provides network-performance information including:
- Latency
- Packet loss
- Probe errors
- Network path information
- ISP information
- ZDX Score
Network Intelligence can analyze paths involving the client, ISP, Zscaler Zero Trust Exchange, and application to help identify network-related problems.
15. What is Real User Monitoring (RUM) in ZDX?
Answer:
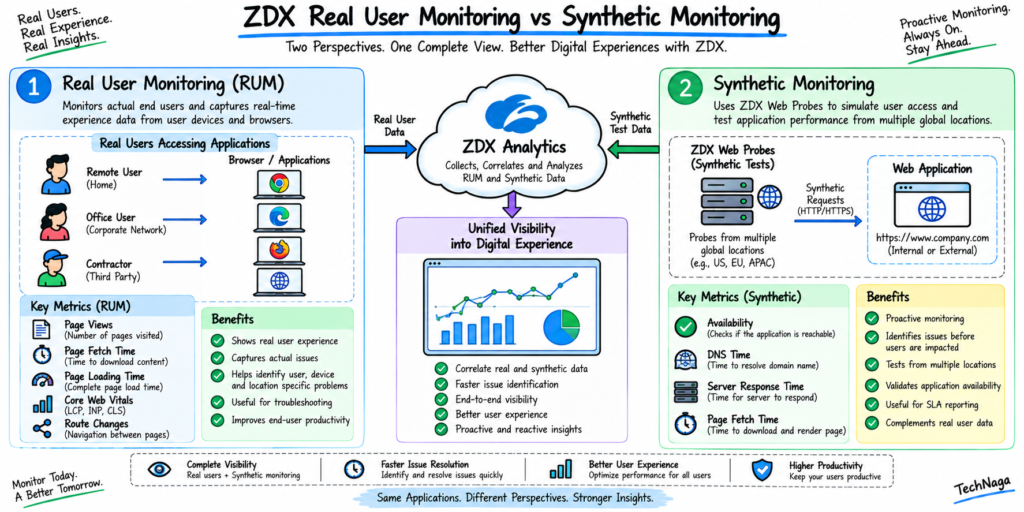
Real User Monitoring (RUM) collects performance information from actual users interacting with web applications through supported browsers.
RUM can provide metrics such as:
- Page Fetch Time
- Page Loading Time
- Core Web Vitals
- Page Views
- Route Changes
Unlike synthetic monitoring, RUM represents the experience of actual users.
4. Zscaler Digital Experience Monitoring and Analysis
16. What is the difference between Synthetic Monitoring and RUM?
Answer:
Synthetic Monitoring uses probes to test application or network performance in a controlled manner.
RUM collects performance information from real users interacting with applications.
For example:
Synthetic:
ZDX periodically tests an application and measures its performance.
RUM:
ZDX measures how actual users experience the application through their browsers.
ZDX can also use a combined score when both monitoring approaches are configured.
17. What is Network Intelligence in ZDX?
Answer:
Network Intelligence provides visibility into network performance from the last-mile ISP through the Zscaler Zero Trust Exchange toward applications.
It can help identify:
- ISP problems
- Intermediate network problems
- Latency increases
- Packet loss
- Network anomalies
- Affected users and locations
This makes Network Intelligence useful for troubleshooting connectivity issues that span multiple network segments.
18. How does ZDX identify ISP problems?
Answer:
ZDX analyzes network-path information and compares network performance against established baselines. It can identify patterns such as increased latency or packet loss associated with particular ISPs or network paths.
Administrators can then investigate impacted locations, users, ISPs, and applications to determine the scope of the issue.
19. What is ZDX Application Monitoring?
Answer:
ZDX Application Monitoring provides visibility into the performance and availability of configured applications.
Administrators can examine application scores, performance trends, impacted users, locations, departments, and probe measurements.
For Web Probes, ZDX can display metrics such as Page Fetch Time, Server Response Time, DNS Time, and Availability.
20. What is the ZDX Users Overview?
Answer:
The Users Overview provides information about the digital experience of users during a selected time period.
Administrators can review:
- User ZDX Score
- Application experience
- Operating system information
- User location
- RUM information when enabled
This helps IT teams identify individual users or groups experiencing poor application performance.
5. Zscaler Digital Experience Alerts and Troubleshooting
21. What are ZDX Alerts?
Answer:
ZDX Alerts provide notifications when configured conditions or thresholds are met.
Alerts can be created for different areas such as:
- Applications
- Devices
- Networks
- Incidents
- Network Intelligence
- RUM
- ZDX Score
Depending on the configuration, alert information can be delivered through email or webhook integrations.
22. What is the ZDX Incidents Dashboard?
Answer:
The Incidents Dashboard helps identify issues affecting multiple users or devices.
Current ZDX documentation identifies incident areas including:
- Device
- Wi-Fi
- Last Mile ISP
- Intermediate ISP
- ZIA Public Service Edge
- ZPA Private Access
- Application
ZDX uses analytics and ML-based detection to identify patterns associated with widespread issues.
23. How would you troubleshoot a user reporting that an application is slow?
Answer:
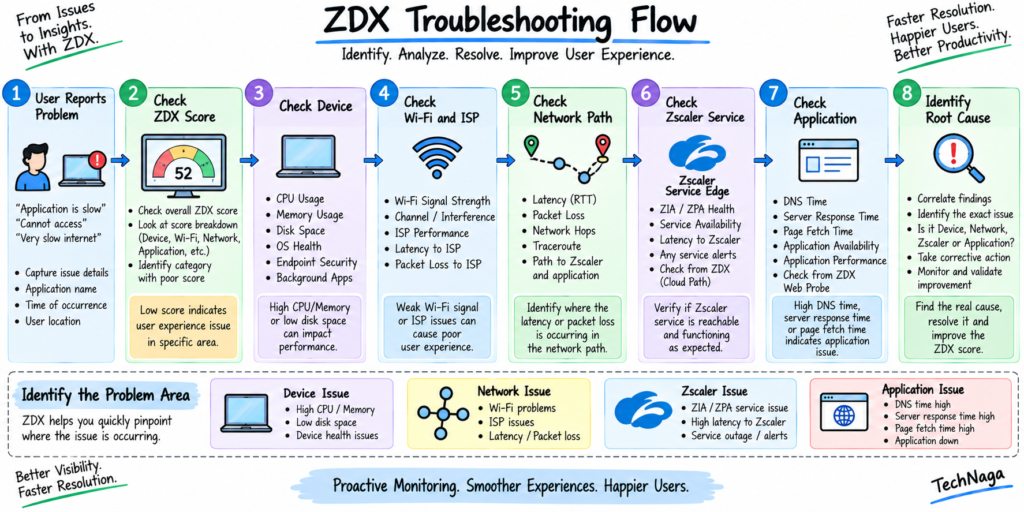
I would follow a structured troubleshooting process:
- Check the user’s ZDX Score.
- Check the affected application’s score.
- Review Page Fetch Time.
- Check DNS Time and Server Response Time.
- Review network latency and packet loss.
- Check Wi-Fi and last-mile ISP information.
- Compare the affected user with other users.
- Check whether the issue is regional or organization-wide.
- Review ZIA/ZPA information if the application uses Zscaler security services.
- Identify the likely problem area and continue with targeted troubleshooting.
This approach helps separate endpoint, network, Zscaler, and application-side issues.
24. How would you troubleshoot high latency using ZDX?
Answer:
First, I would determine where the latency is occurring.
I would review the network path and compare:
Client → ISP → Zscaler Zero Trust Exchange → Application
Then I would check:
- P50/P95 latency
- Packet loss
- ISP
- Network path
- Affected locations
- Affected users
- ZDX Score
If the issue is concentrated around a particular ISP or network segment, I would investigate that path. If latency appears close to the application side, I would investigate the application and server environment.
25. How can ZDX help troubleshoot Wi-Fi problems?
Answer:
ZDX can provide endpoint and network telemetry that helps identify whether poor user experience correlates with local Wi-Fi conditions.
For example, if multiple users in a specific location experience degraded scores while Wi-Fi-related metrics are abnormal, the investigation can focus on the local wireless network rather than immediately assuming that the SaaS application is the problem.
6. Advanced Zscaler Digital Experience Interview Questions
26. What are ZDX collections?
Answer:
Collections allow administrators to organize configured applications into groups for monitoring.
ZDX supports collections such as:
- Unified Communication Collection
- Predefined Apps Collection
- Custom Apps Collection
- Managed collections
Collections help administrators organize applications and monitor their digital experience more efficiently.
27. What are Zscaler Managed Probes?
Answer:
Zscaler Managed Probes operate from within the Zscaler cloud infrastructure. They allow organizations to monitor application or service performance from Zscaler cloud locations toward specified endpoints.
They can complement endpoint-based ZDX monitoring by providing another perspective on application availability and performance.
28. How does ZDX work with ZIA and ZPA?
Answer:
ZDX can provide visibility into the experience of users accessing applications through Zscaler security services.
For example:
ZIA:
User → Client Connector → ZIA → Internet/SaaS Application
ZPA:
User → Client Connector → ZPA → App Connector → Private Application
ZDX can help investigate whether performance degradation is associated with the endpoint, network, Zscaler service path, or application.
Current ZDX incident monitoring also includes ZIA Public Service Edge and ZPA Private Access categories.
29. What is the difference between ZDX and ZIA/ZPA?
Answer:
| Product | Primary Purpose |
|---|---|
| ZIA | Secure access to Internet and SaaS applications |
| ZPA | Zero Trust access to private applications |
| ZDX | Monitor and troubleshoot digital experience |
ZIA and ZPA primarily provide security and access controls, while Zscaler Digital Experience provides visibility into the performance and user experience associated with those environments.
30. Explain a real-world ZDX troubleshooting scenario.
Answer:
Suppose 100 users report that Microsoft 365 is slow.
I would first check the Zscaler Digital Experience application score and identify whether the problem affects all users or a particular region.
Then I would investigate:
Application → User → Location → ISP → Network Path → Device
I would compare Page Fetch Time, DNS Time, Server Response Time, latency, and packet loss.
If affected users are concentrated around one ISP and network latency is elevated, the evidence would point toward a network or ISP-related issue.
If network performance is normal but Server Response Time is high, I would investigate the application or service side.
This structured approach allows Zscaler Digital Experience to narrow down the likely problem area instead of treating every slow application report as a generic network issue.
Related Articles
- Zscaler Interview Questions and Answers: Fundamentals
Zscaler Interview Questions and Answers: Fundamentals - ZIA Interview Questions and Answers: In-Depth Guide
Use your published ZIA article URL here. - ZPA Interview Questions and Answers: In-Depth Guide
Use your published ZPA article URL here. - What Is Cybersecurity and Why It Is Important Today
What Is Cybersecurity and Why It Is Important Today - Networks and Network Security Basics 2026
Networks and Network Security Basics 2026
- Zscaler Digital Experience (ZDX)
Zscaler Digital Experience (ZDX) - Understanding the ZDX Score
Understanding the ZDX Score - Understanding Real User Monitoring (RUM)
Understanding Real User Monitoring - Visualizing User Connectivity with ZDX
ZDX User Connectivity Reference Architecture - Evaluating Application Details in ZDX
Evaluating Application Details - Monitoring the Users Overview
Monitoring Users in ZDX - Configuring ZDX Alert Rules
Configuring ZDX Alert Rules - ZDX Configuration and Collections
ZDX Configuration Documentation
Disclaimer:
This article is based on my own professional experience working with Zscaler, along with knowledge gained through Zscaler-related interviews, technical discussions, and product documentation. The questions and answers are provided for educational and interview-preparation purposes and may not represent the exact questions asked by every organization.
Zscaler features, product capabilities, documentation, terminology, and user interfaces can change over time. Always verify technical details, supported features, configurations, and current product behavior against the official Zscaler documentation before implementing any configuration in a production environment.